
Gaydos Monument
Welcome to your Gaydos Monument online home!
Below you will find a an overview of each month’s Google Campaign. The analytics provide you with a snapshot of your company’s overall digital performance.

MONTHLY GOOGLE REPORTS
We take a deep dive into your current Google campaign to determine what’s driving leads. The analytics can provide actionable insights, so we can help make smart decisions in optimizing your campaigns and general outreach for maximum ROI. We’re happy to discuss any results and questions to make the best possible campaigns for you.
2026 Campaigns
- View Google Campaign Results
- Highlights month of May 2026
Campaign Notes
A busier month showing more Clicks
More quality click leads
View ongoing Campaign Landing Page
- View Google Campaign Results
- Highlights month of March 2026
Campaign Notes
A busier month showing more Clicks
More clicks lead to more impressions
View ongoing Campaign Landing Page
- View Google Campaign Results
- Highlights month of March 2026
Campaign Notes
- Cost: $3,130
Similar to April results across the board
View ongoing Campaign Landing Page
- View Google Campaign Results
Highlights month of February 2026
Ongoing Campaign Notes
Continue strategy laid in 2025 into the new year.
- View Google Campaign Results
Highlights January and the start of the 2026 Google campaign.
Campaign Notes
Continue strategy laid in 2025 into the new year.
- Moving Forward
- Consumers will continue to be driven to the Campaign Landing Page.
2025 Campaigns
- Google Campaign Results
Highlights January and the start of the 2025 Google campaign.
Campaign Notes
Continue strategy laid in 2024 into the new year.
- Moving Forward
- Consumers will continue to be driven to the Campaign Landing Page.
- Google Campaign Results
Highlights the Google campaign for February 2025.
Campaign Notes
Continuing strategy laid in 2024.
- Moving Forward
- Consumers will continue to be driven to the Campaign Landing Page.
- Google Campaign Results
Highlights the Google campaign for March 2025.
Campaign Notes
Continuing strategy laid in 2024.
- Moving Forward
- Consumers will continue to be driven to the Campaign Landing Page.
- Google Campaign Results
Highlights the Google campaign for April 2025.
Campaign Notes
Adapting to changes/trends in the marketing to fully optimize the campaign.
Added negative keywords to discourage some terms from being searched.
Added keyword themes to campaign assets to further optimize Max Performance campaign.
Updated video, headlines and keywords.
- Moving Forward
- Consumers will continue to be driven to the Campaign Landing Page.
- Google Campaign Results
Highlights the Google campaign for May 2025
Campaign Notes
Deleted negative keywords
Added new categories/themes to existing campaigns
Added updated assets (photos) to campaigns
Updated headlines and keywords
Adjusted budgets for optimized spending
- Moving Forward
- Consumers will continue to be driven to the Campaign Landing Page.
- Google Campaign Results
Highlights the Google campaign for May 2025
Campaign Notes
Added new categories/themes to existing campaigns
Updated headlines & keywords
Updated budget to optimize CTR
- Landing Page Info
- Consumers will continue to be driven to the Campaign Landing Page.
- Google Campaign Results
Highlights the Google campaign for July 2025
Campaign Notes
Added copy/headline
More emphasis on calling has increased number of calls
CPC decreased for more clicks
- Landing Page Info
- Consumers will continue to be driven to the Campaign Landing Page.
- Google Campaign Results
Highlights the Google campaign for July 2025
Campaign Notes
- Added Keywords
- Eliminated poorly performing keywords
- More emphasis on quality clicks
- Landing Page Info
- Consumers will continue to be driven to the Campaign Landing Page.
- Google Campaign Results
- Highlights the Google campaign for September 2025
- Campaign Notes
- Keyword addition
- Negative keyword optimization
- Higher quality clicks
- Landing Page Info
- Consumers will continue to be driven to the Campaign Landing Page.
- Google Campaign Results
- Highlights the Google campaign for October 2025
- Campaign Notes
- Optimized keywords
- Negative keyword optimization
- More quality clicks
- Landing Page Info
- Consumers will continue to be driven to the Campaign Landing Page.
- Google Campaign Results
- Highlights the Google campaign for November 2025
- Campaign Notes
- Focus on quality clicks and calls
- Cost Per Click has decreased
- Showing most traffic (96%) coming through phones
- Landing Page Info
- Consumers continue to be driven to the Campaign Landing Page
- Google Campaign Results
- Highlights the Google campaign for December 2025
- Campaign Notes
- Campaign spent $3,005
- Focus on quality clicks and calls
- Cost Per Click increased, but campaign showed good impressions and interactions for the month
- Landing Page Info
- Consumers continue to be driven to the Campaign Landing Page
2024 Campaigns
Highlights the start of the new 2024. Below is January’s overall Google Campaign Results with notes.
Campaign Notes
- Continue discussion points.
Moving Forward
Consumers be driven to the Campaign Landing Page.
Highlights February’s overall Google Campaign Results with notes.
Campaign Notes
Ongoing optimization
Ongoing keyword monitoring
Moving Forward
Consumers will continue to be driven to the Campaign Landing Page.
- Google Campaign Results
- Highlights February’s overall Google Campaign Results with notes.
- Campaign Notes
- Ongoing optimization
- Ongoing keyword monitoring
- Moving Forward
- Consumers will continue to be driven to the Campaign Landing Page.
- Google Campaign Results
- Highlights past month’s overall Google Campaign Results with notes.
- Campaign Notes
- Data continues to be stable while increasing clicks and impressions share compared to last month.
- Ongoing optimization
- Ongoing keyword monitoring
- Moving Forward
- Consumers will continue to be driven to the Campaign Landing Page.
- Google Campaign Results
- Highlights past month’s overall Google Campaign Results with notes.
- Campaign Notes
- Ongoing optimization
- Ongoing keyword monitoring
- Moving Forward
- Consumers will continue to be driven to the Campaign Landing Page.
- Google Campaign Results
- Highlights past month’s overall Google Campaign Results with notes.
- Campaign Notes
- Upgraded display campaign to Max Perfoamnce campaign to reach additional targeted consumers
- Revised headlines
- Keyword optimization and continued monitoring
- Moving Forward
- Consumers will continue to be driven to the Campaign Landing Page.
- Google Campaign Results
- Highlights past month’s overall Google Campaign Results with notes.
- Campaign Notes
- Revised Copy
- Add Keywords
- Added new snippets to existing ads
- Paused underperforming keywords
- Looking Forward
- Visitors will continue to be driven to the Campaign Landing Page.
- Google Campaign Results
- Highlights past month’s overall Google Campaign Results with notes.
- Campaign Notes
- Revised Copy
- Add Keywords
- Campaign Landing Page
- Visitors will continue to be driven to the Campaign Landing Page.
- Google Campaign Results
- Highlights past month’s overall Google Campaign Results with notes.
- Campaign Notes
- Revised keywords
- Campaign Landing Page
- Visitors will continue to be driven to the Campaign Landing Page.
- Google Campaign Results
- Highlights past month’s overall Google Campaign Results with notes.
- Campaign Notes
- Revised keywords
- Adjust bidding strategy
- Calls are becoming more consistent
- Campaign Landing Page
- Visitors will continue to be driven to the Campaign Landing Page.
- Google Campaign Results
- Highlights past month’s overall Google Campaign results with notes.
- Campaign Notes
- Revised keywords
- Adjust bidding strategy
- Campaign Landing Page
- Visitors will continue to be driven to the Campaign Landing Page.
- Google Campaign Results
Highlights the the end of 2024. Below is the end of the year results for December 2024.
Campaign Notes
Continue strategy laid in 2024 into the new year for 2025.
- Moving Forward
- Consumers will continue to be driven to the Campaign Landing Page.
2023 Campaigns
- Google Campaign Results
- Google Campaign Results
- Campaign Notes:
- We added explanations within the campaign results link. Over the past month, we have implemented several changes to our campaign set-up and structure, so it is important to understand what these analytics mean.
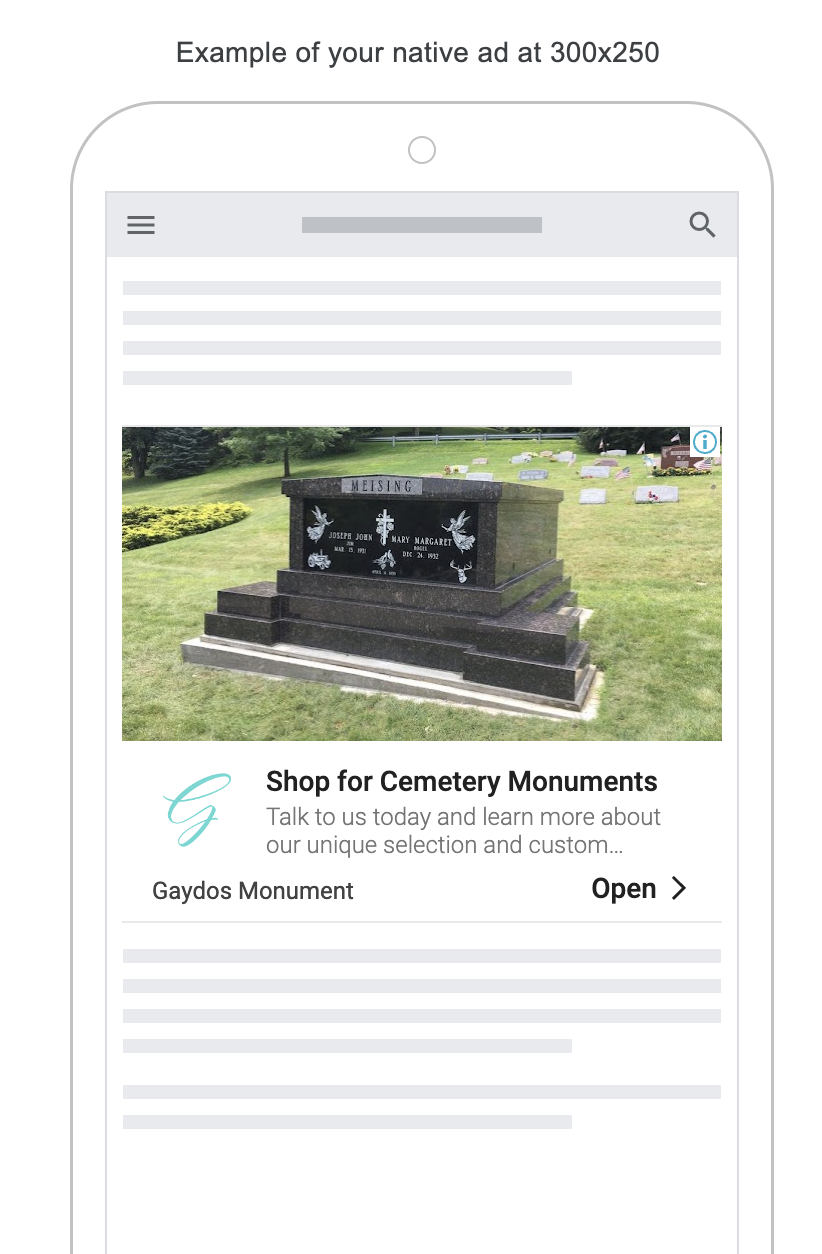
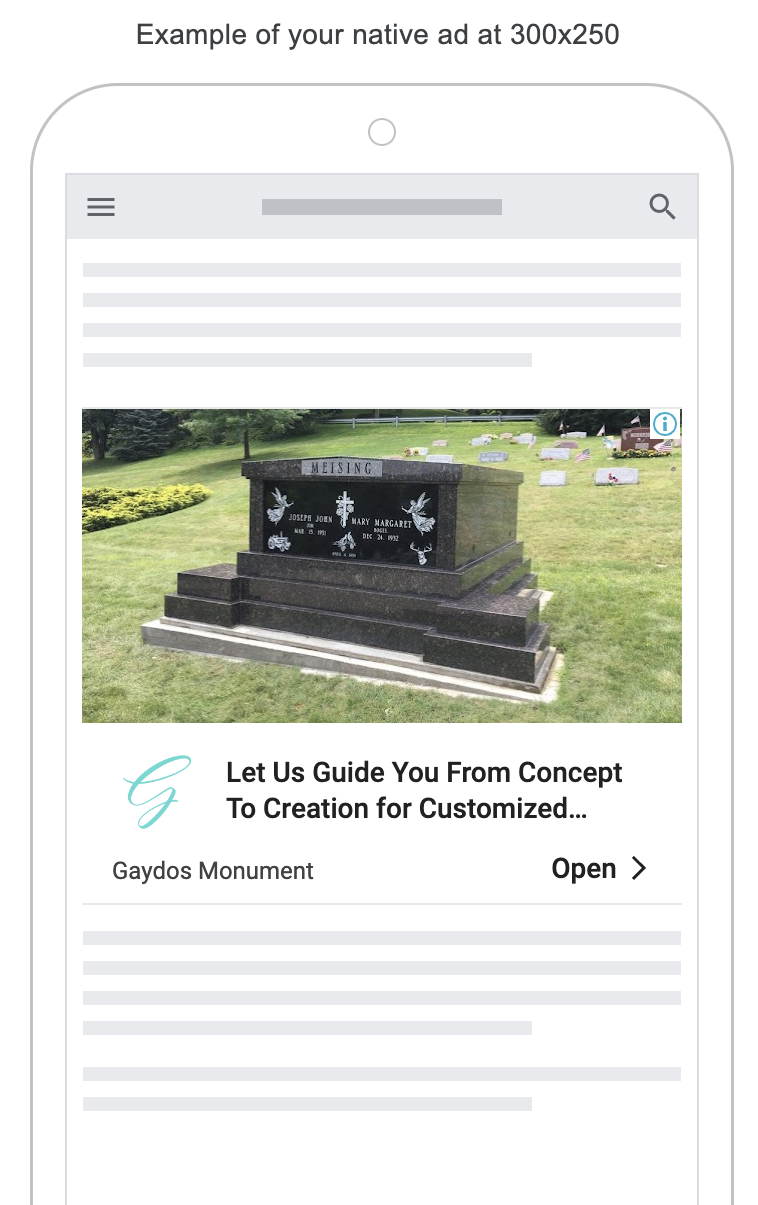
- Added campaign images so you can see what type of ads are running throughout the campaign. This also gives you the chance to review any changes you may want to see in future ads.
- Google Campaign Results
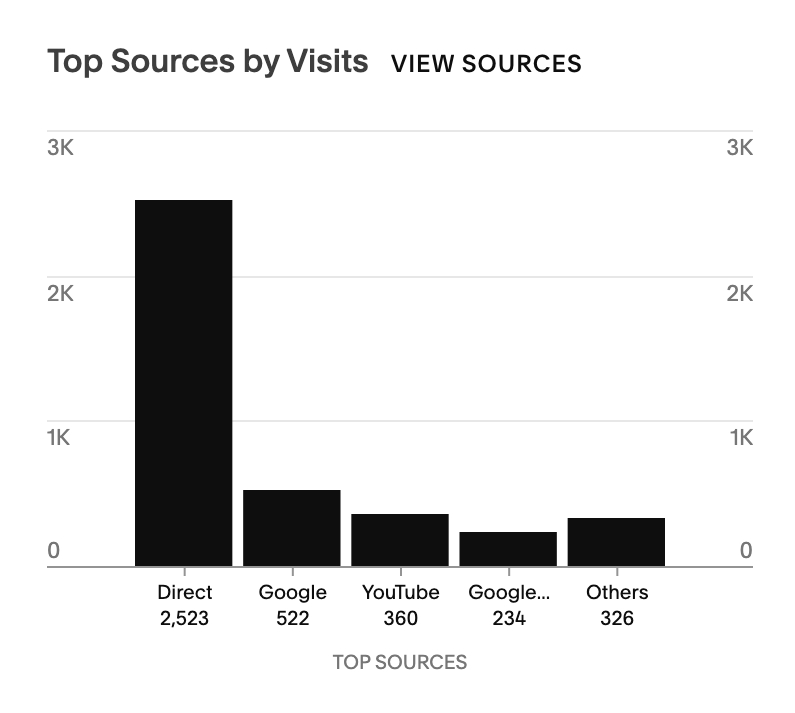
- Website Site Sources
- Campaign Notes:
- The new graph shows you where your website traffic is coming from. We can see a direct comparison between direct customers (consumers who go directly to the website without search) verse Google visitors (consumers who use Google search to find the business).
- Google Campaign Results
- Showing this past month’s Google analytics.
- Website Site Sources
- The graph shows you where your website traffic is coming from.
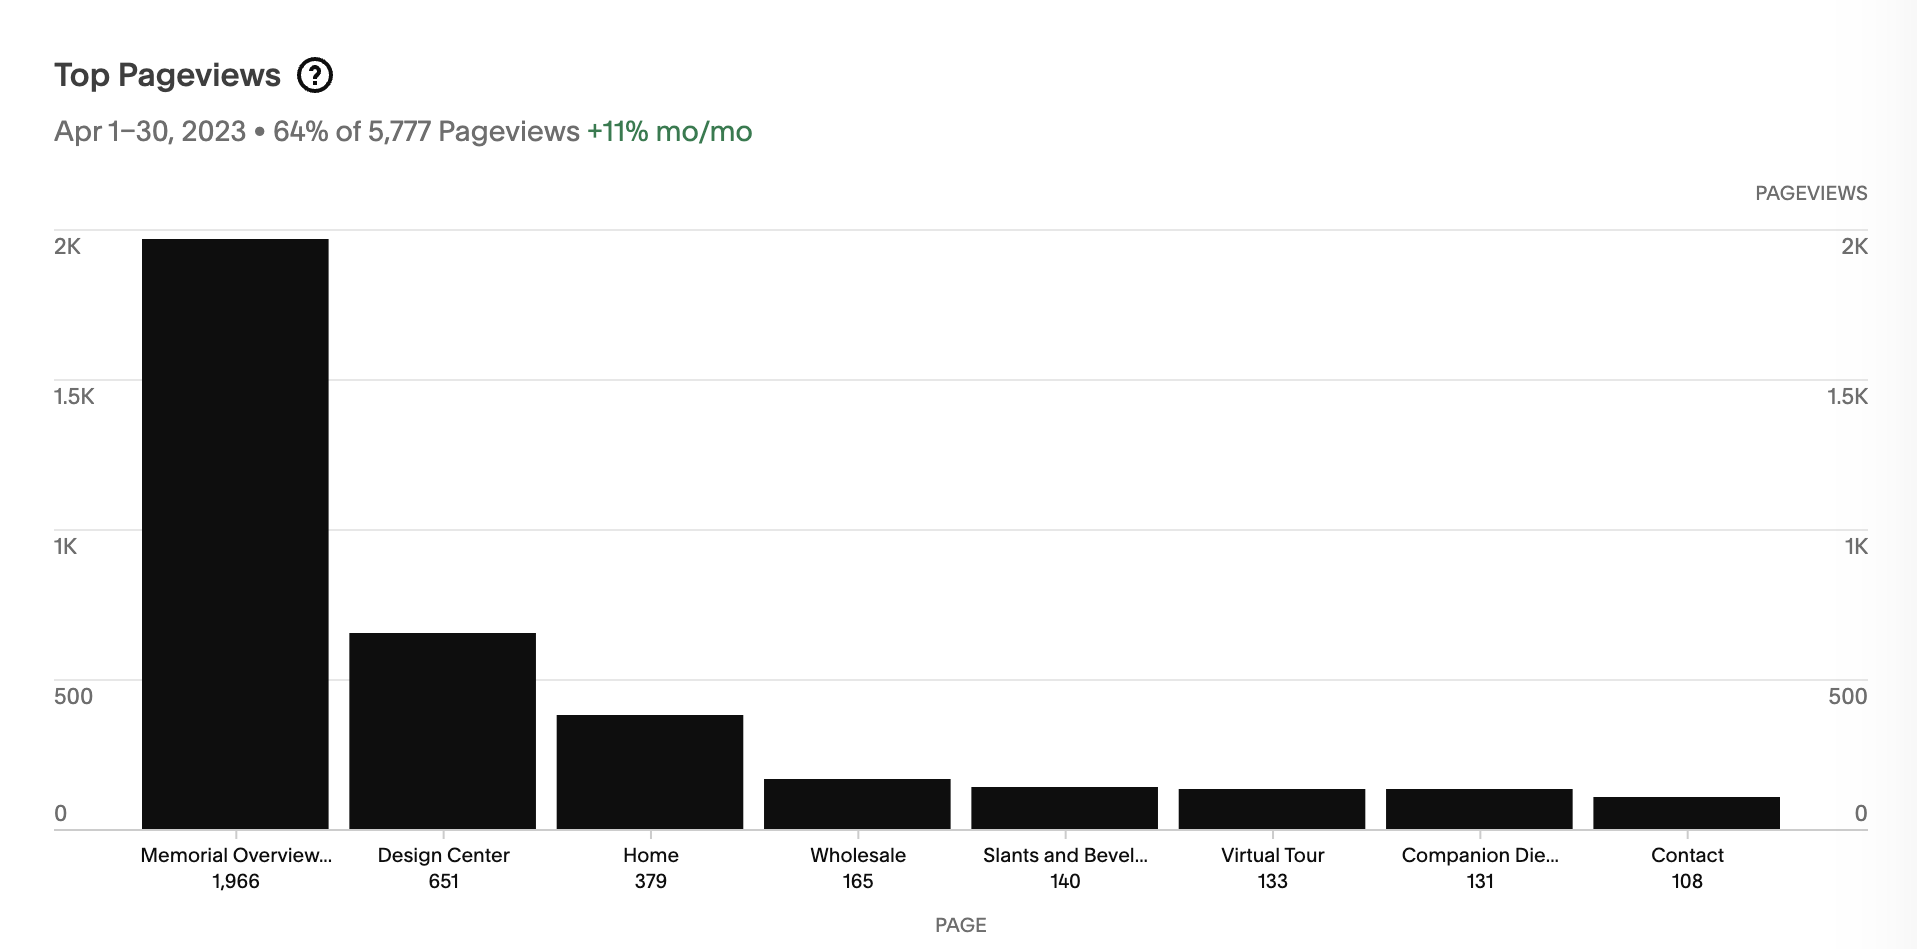
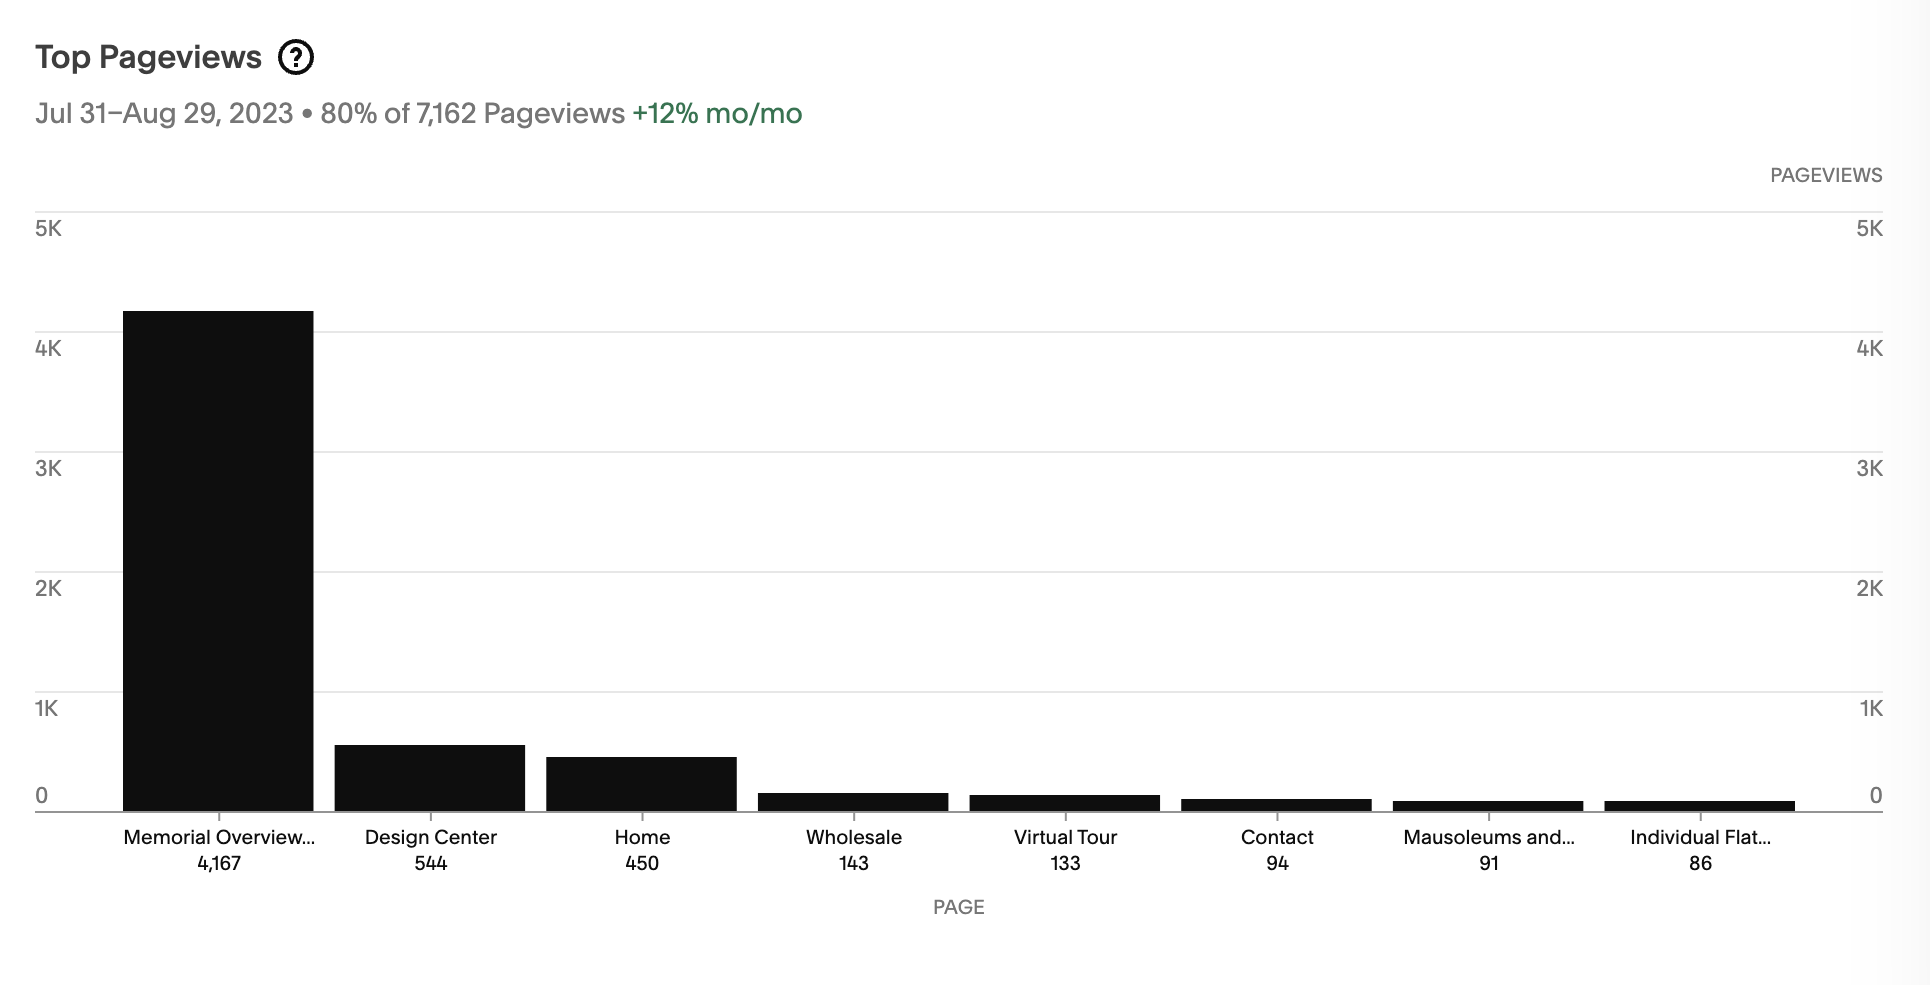
- Campaign Page Results
- Our landing page far out performed other web pages with a total of 1,966 views.
- Graph shows how much traffic the campaign landing page is bring in compared to other pages.
- Campaign Notes:
- Updated the home page to the website.
- Implemented a new search campaign to improve future amount of clicks and CTR (Click-through-rate). We need to continue narrowing down our audience segment. There was a slight improvement this past month. We look to strengthen this trend.
- Google Campaign Results
- This past month made up for past months that underperformed the budget. With additional money spent these two months, there was an increase in clicks and interactions.
- Website Site Sources
- The graph shows you where your website traffic is coming from. A high number of traffic continues to be driven from Google search.
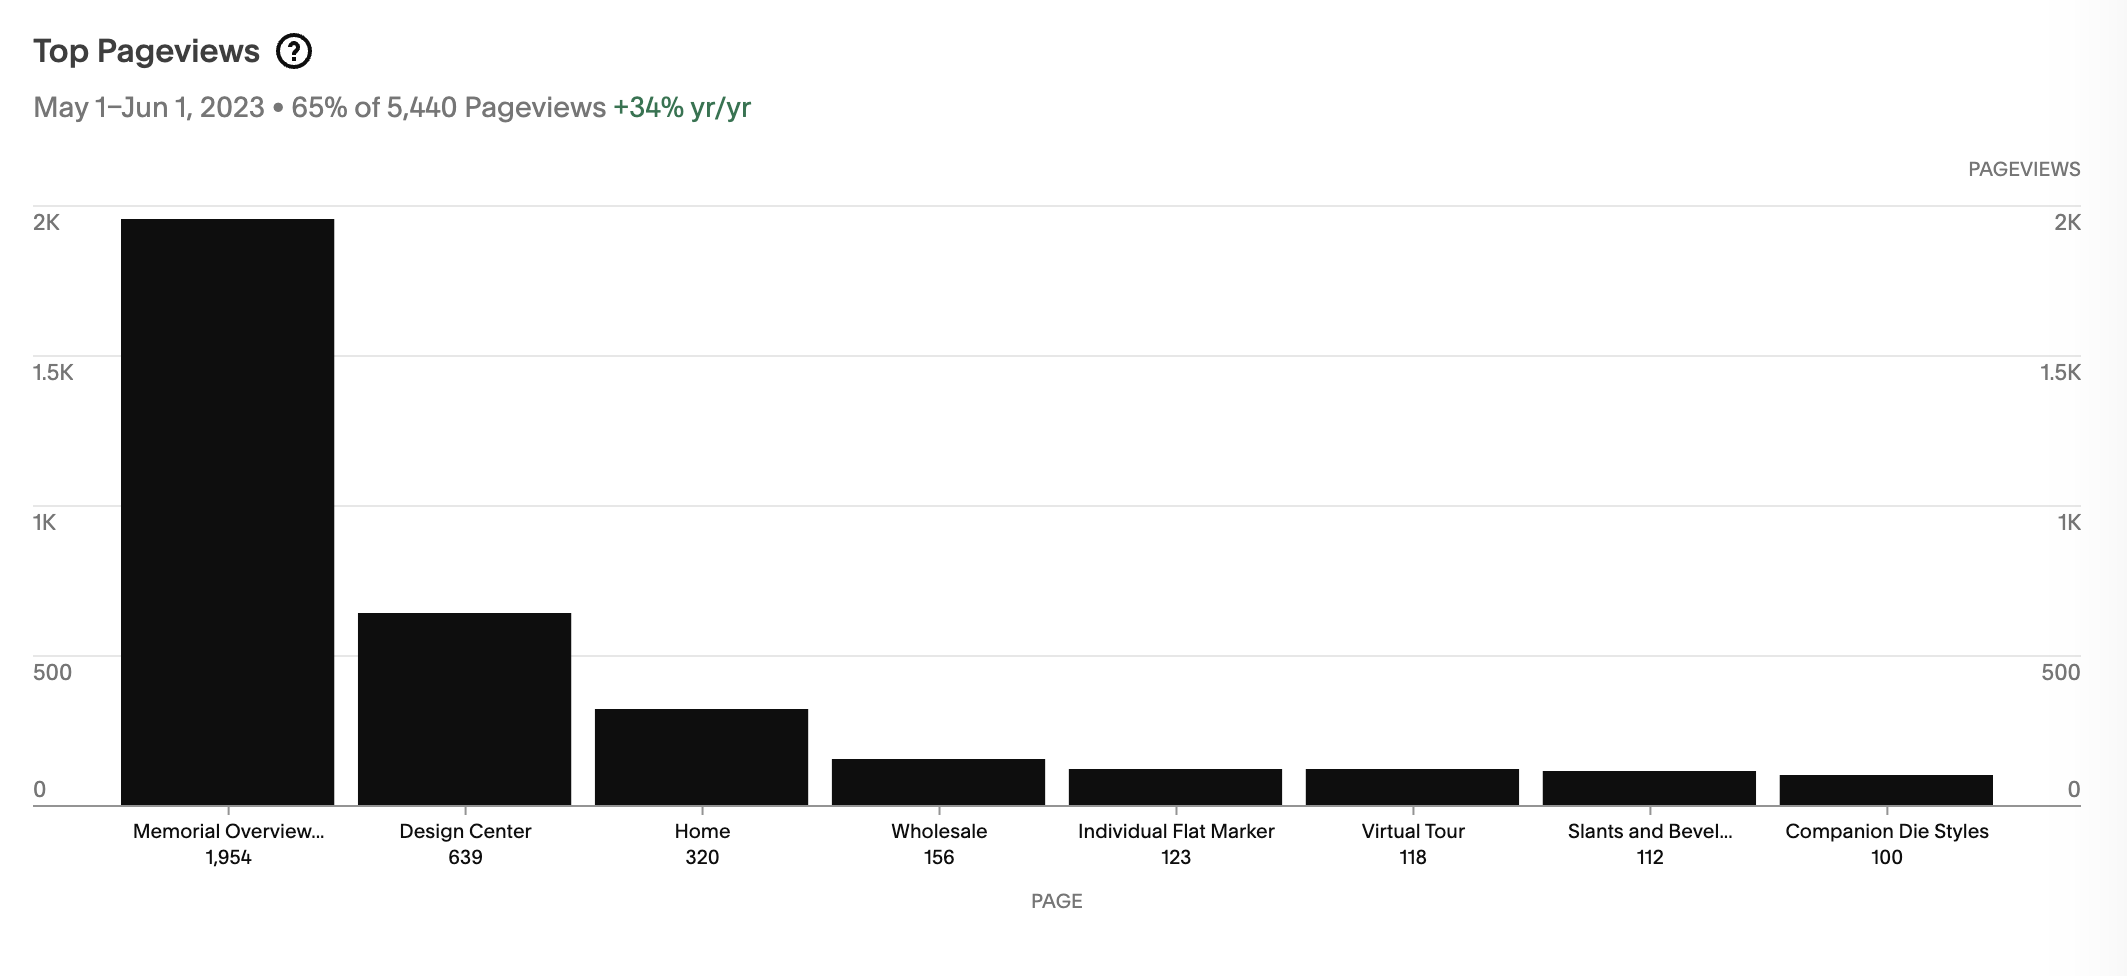
- Campaign Page Results
- The graph highlights how much traffic the campaign landing page is driving compared to other pages.
- The landing page far out performed any other page on the website with a total of 1,908 views in May.
- Campaign Notes
- The new search campaign will continue to perform better as it continues to learn from its audience.
- Moving Forward
- Since this month spent slightly over budget, we’ll slightly decrease the daily budget spend and see how this effects the overall click/interaction rates. We’ll continue focusing on quality leads over general interactions. Moving forward, we’ll continue driving the audience to the campaign landing page.
- Google Campaign Results
- This graph highlights the month of June’s overall Google Campaign Results with notes.
- Website Site Sources
- The graph shows you where your website traffic is coming from. A high number of visitors continue to be driven from Google searches and direct traffic.
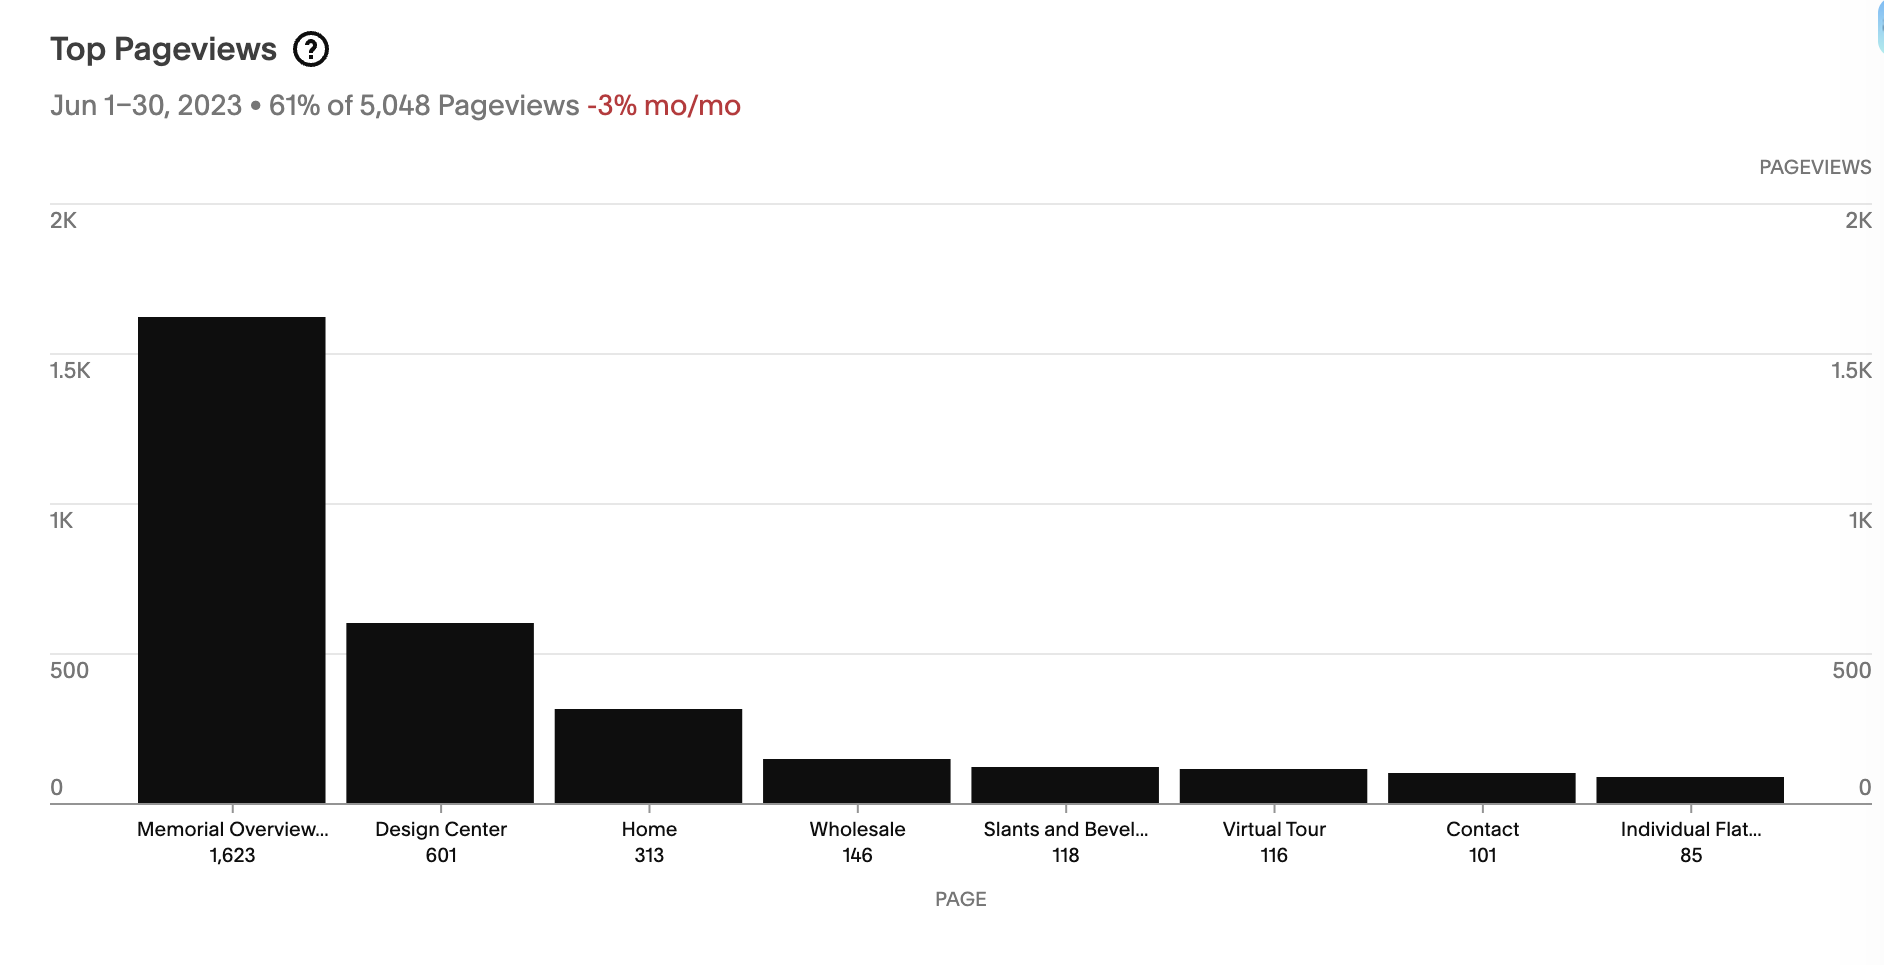
- Campaign Page Results
- The graph highlights how much traffic the campaign landing page is driving compared to other pages.
- Again, the landing page far out performed any other pages on the website.
- Campaign Notes
- The month of June spent close to our allotted budget of $2,500 with spending varying on demand. With a lighter spend this month (approximately $2,320), overall numbers were slightly lower, but the overall results were more optimized. The overall cost-per-click was down while keeping a similar range of impressions, clicks and interactions.
- Moving Forward
- We’ll look to stay in a similar range of spending while continuing to optimize the overall campaign where needed.
- Moving forward, we’ll continue driving the audience to the campaign landing page.
- Google Campaign Results
- This graph highlights the month of July’s overall Google Campaign Results with notes.
- Website Site Sources
- The graph shows where general overall traffic is coming from on your website.
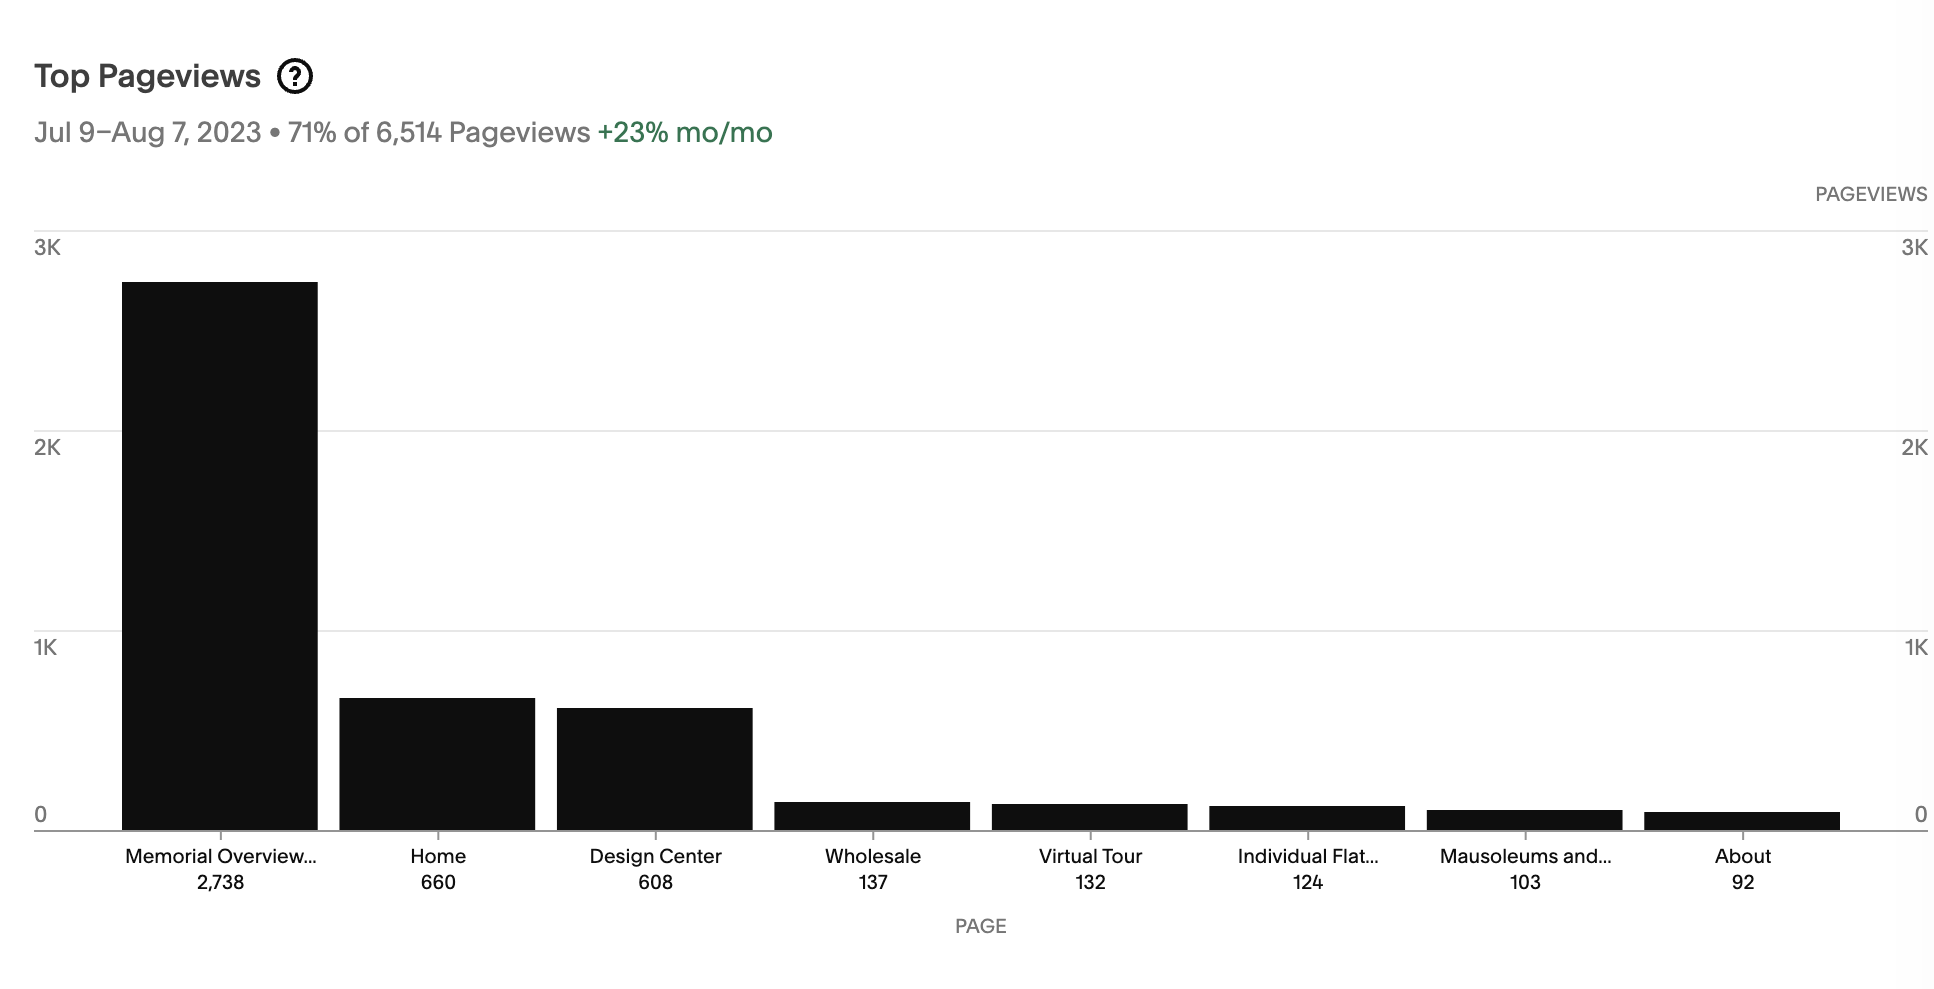
- Campaign Page Results
- The graph specifically highlights the campaign performance and show exactly how many people are being driven to the website directly by the google campaign.
- The landing page had one of its best overall months in bringing in more than 2,700 unique visitors in July, which far out-performed any other page on the website.
- Campaign Notes
- The month of July spent close to our allotted monthly budget of $2,500 with spending varying on demand. With a slightly lighter spend this month compared to a slightly higher spend last month, the budget tends to balance out over multiple months.
- Moving Forward
- We’ll look to stay in a similar range of spending while continuing to optimize the overall campaign where needed.
- We’ll also continue driving potential consumers to the campaign landing page.
- Google Campaign Results
- This graph highlights the month of August’s overall Google Campaign Results with notes.
- Website Site Sources
- The graph shows where general overall traffic is coming from on your website.
- Campaign Page Results
- The graph specifically highlights the campaign performance and show exactly how many people are being driven to the website directly by the google campaign.
- With more than 4,000 unique visitors in August, the campaign landing page far out-performed any other page on the website.
- Campaign Notes
- The month of July spent close to our allotted monthly budget of $2,500.
- Moving Forward
- We’ll look to stay in a similar range of spending while continuing to optimize the overall campaign where needed.
- The campaign focus will continue to be driving interested consumers to the campaign landing page.
- Google Campaign Results
- Highlights month’s overall Google Campaign Results with notes.
- Website Site Sources
- The graph shows where general overall traffic is coming from on your website.
- Campaign Page Results
- The graph specifically highlights the campaign performance and show exactly how many people are being driven to the website directly by the google campaign. This month saw more than 3,500 visits to the campaign landing page.
- Campaign Notes
- The month spent close to our allotted monthly budget of $2,500, so we stopped the campaign toward the end of the month as to not go too far over budget.
- Moving Forward
- The campaign focus will continue to be driving more clicks to the website and interested consumers to the campaign landing page
- Google Campaign Results
- Highlights month’s overall Google Campaign Results with notes.
- Campaign Notes
- Maximized Conversion value is a value-based bidding strategy which is designed to drive as much conversion value as possible within your budget.
- Improved optimization of your overall campaign. Optimization score is an estimate of how well your Google Ads account is set to perform. Optimization score runs from 0% to 100%, with 100% meaning that your account could perform at its full potential. Along with the score, you’ll see a list of recommendations that can help you optimize each campaign.
- Reviewed Budget Over Delivery causing fluctuations in your daily spend but the monthly budget will remain relatively the same.
- Revised clicks/conversions/cost per conversion
- Added additional keywords
- Moving Forward
- The campaign focus will continue to be driving more clicks to the website and interested consumers to the campaign landing page
- Google Campaign Results
- Highlights the month’s overall Google Campaign Results with notes.
- Campaign Notes
- After adjusting maximized conversion value, the campaign was learning to drive more conversion.
- Improved overall optimization score
- Added additional keywords
- Moving Forward
- We’ll finalize 2023 with December’s campaign. We’ll look to meet in January to discuss and new goals and objectives.
- The campaign focus will continue learning and focus will be on driving more conversion value. Consumers will continue to be driven to the campaign landing page.
- Google Campaign Results
- Highlights the month’s overall Google Campaign Results with notes.
- Campaign Notes
- Improved overall optimization score
- Added additional keywords
- Moving Forward
- The campaign focus will continue learning and focus will be on driving more conversion value. Consumers will continue to be driven to the campaign landing page.
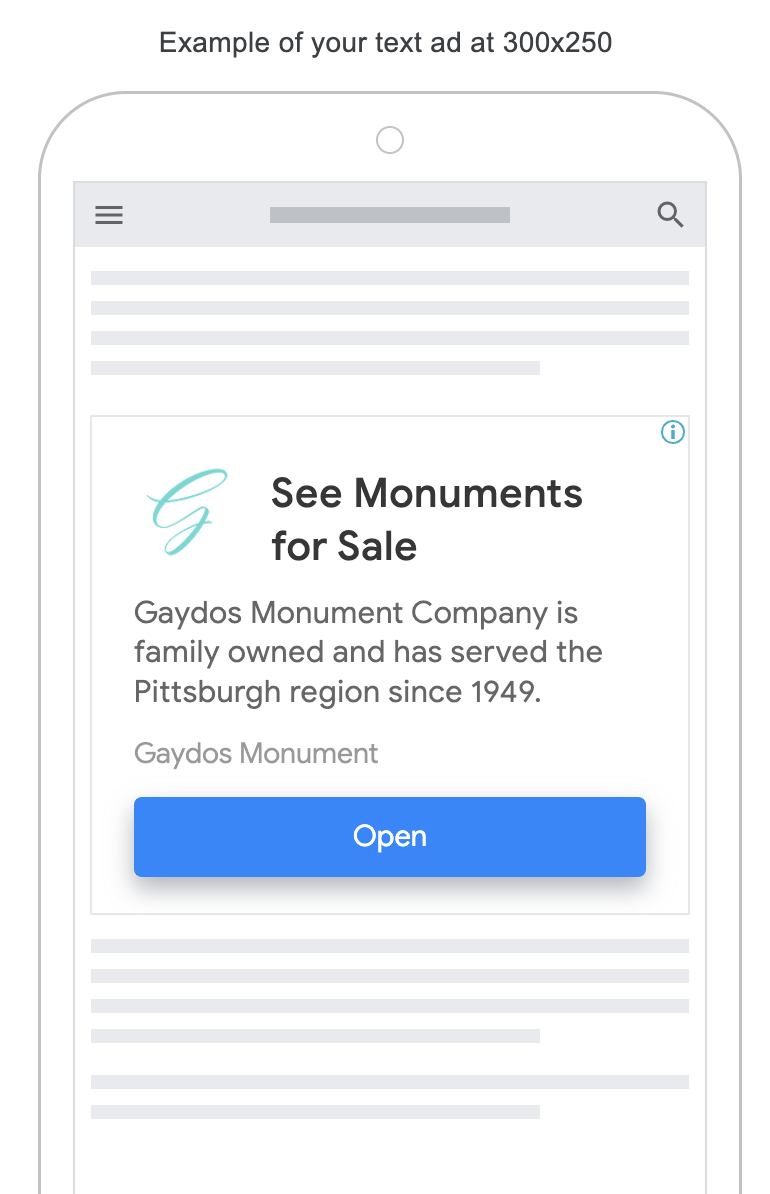
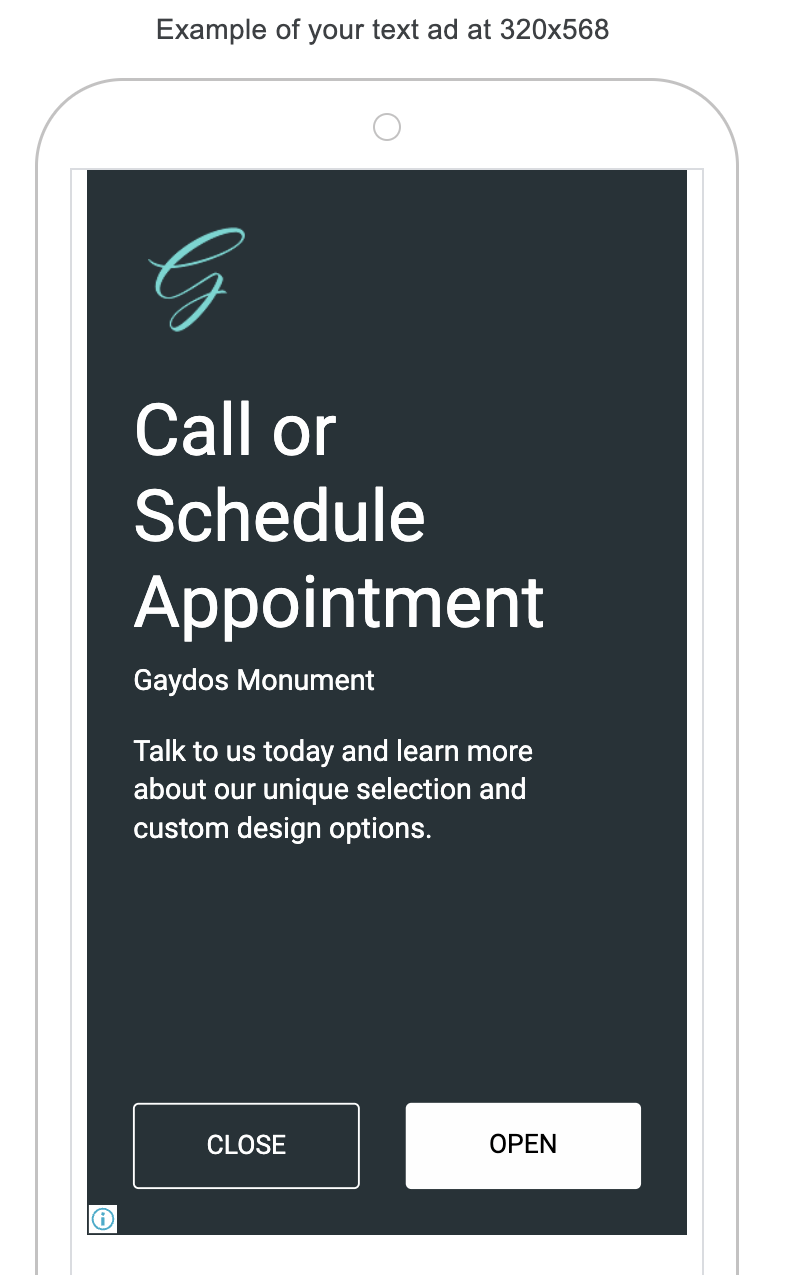
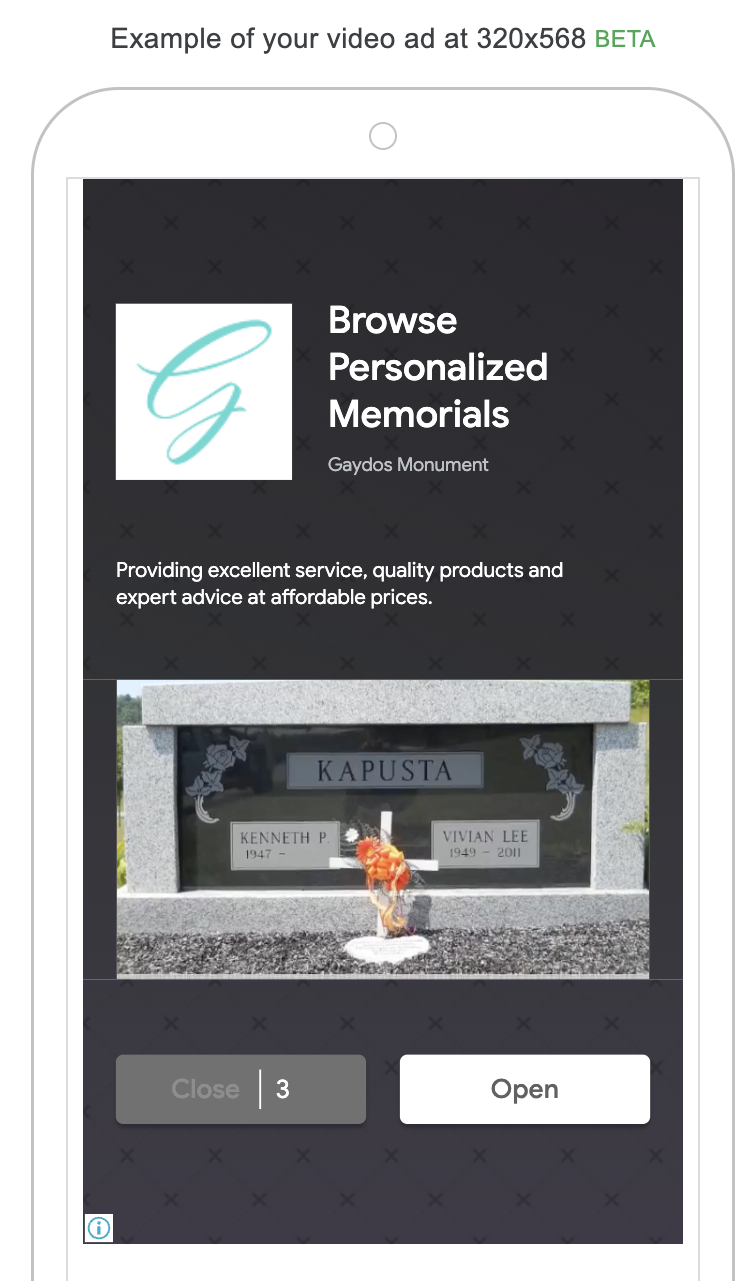
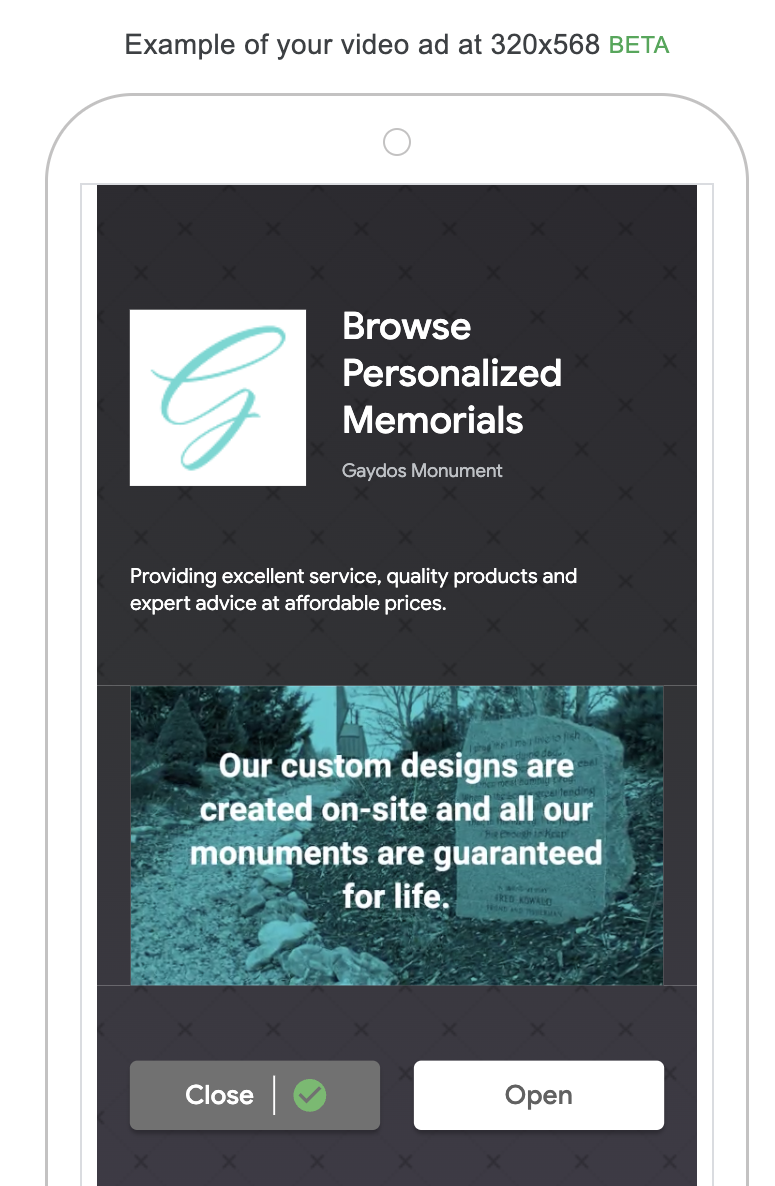
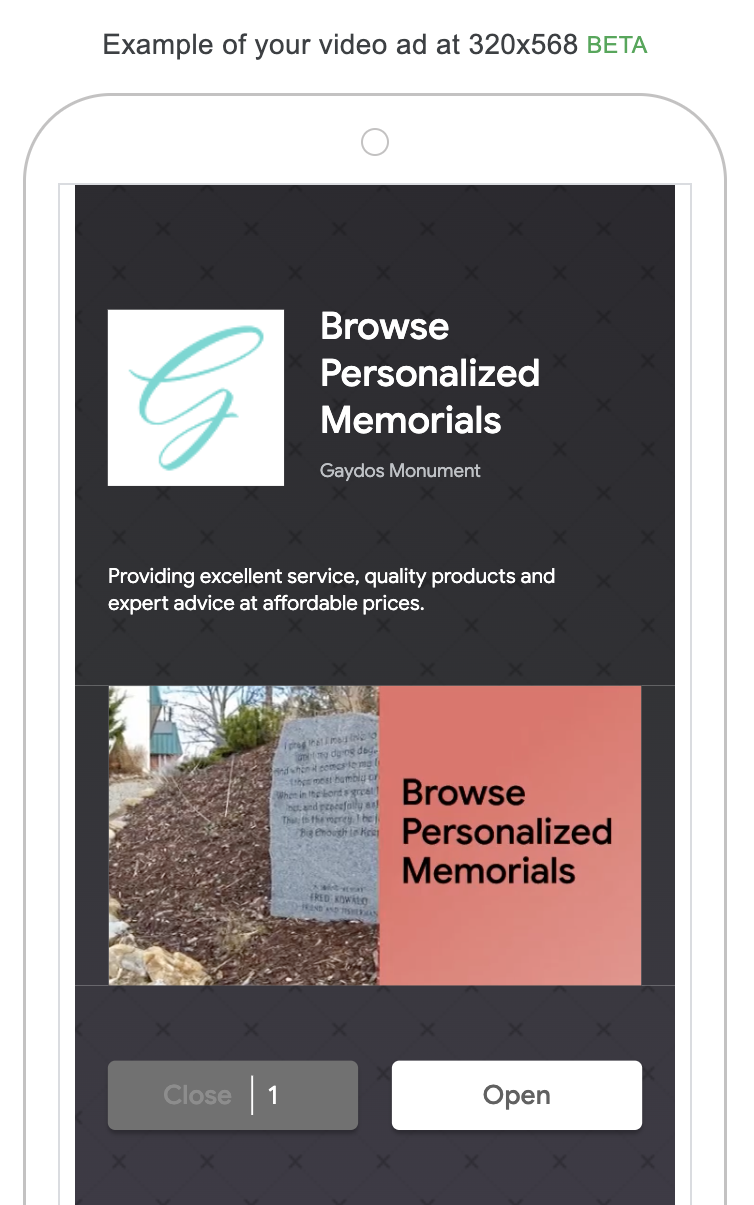
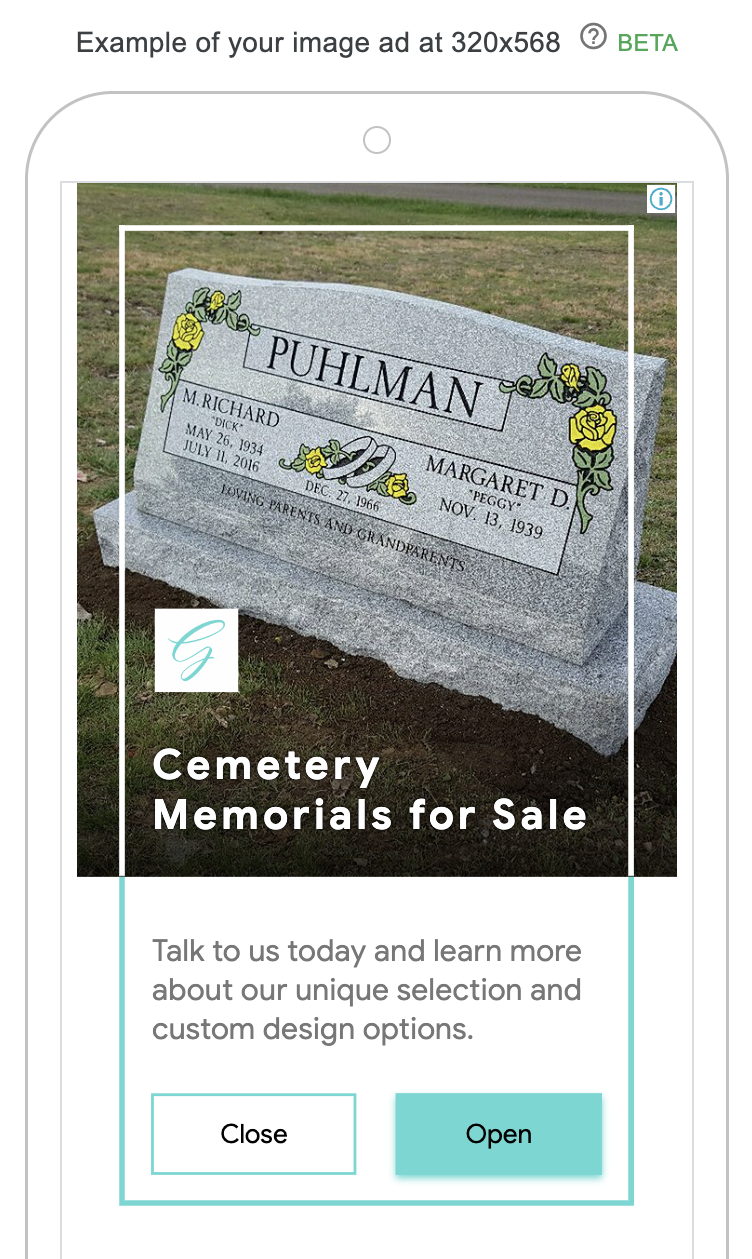
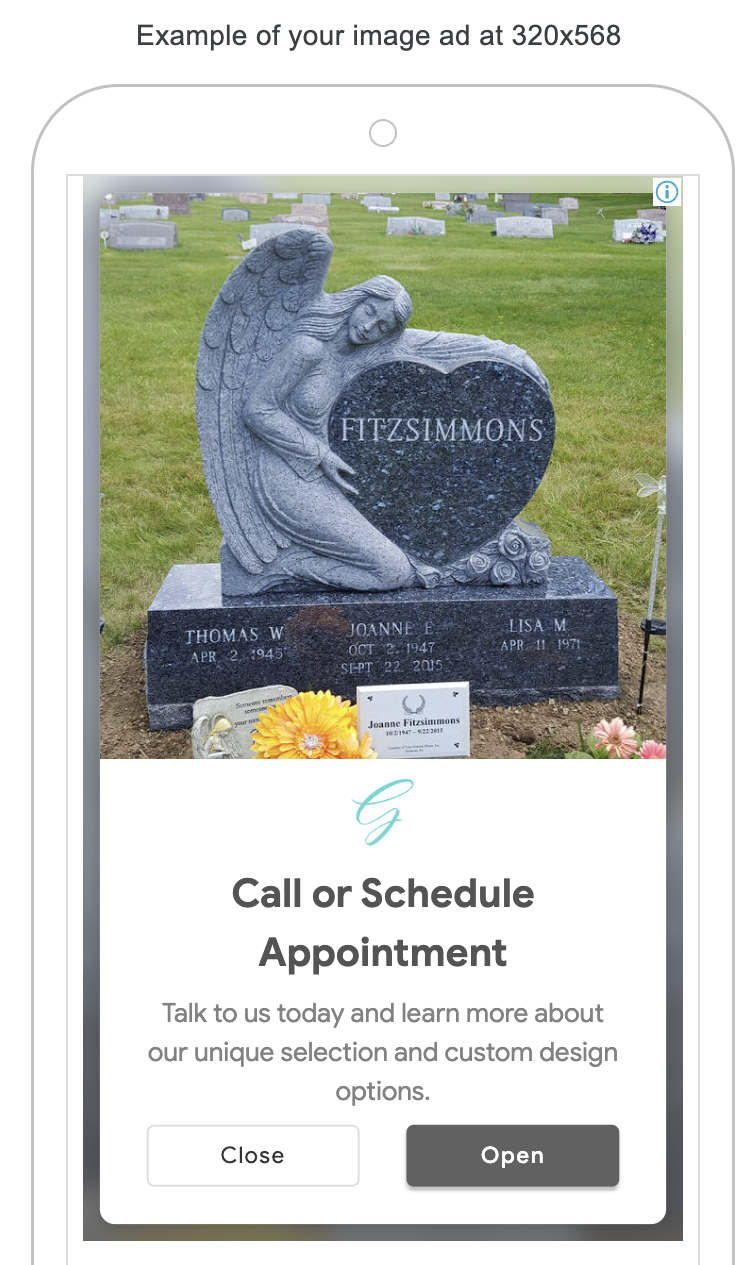
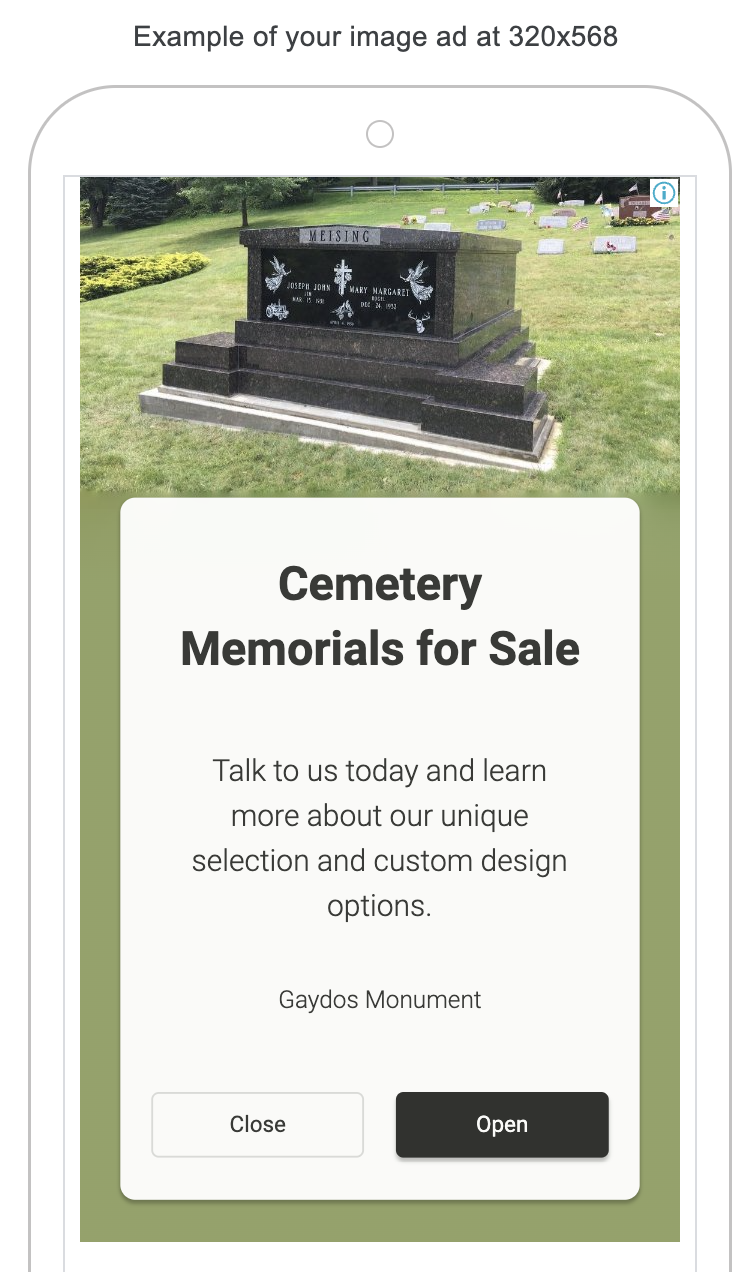
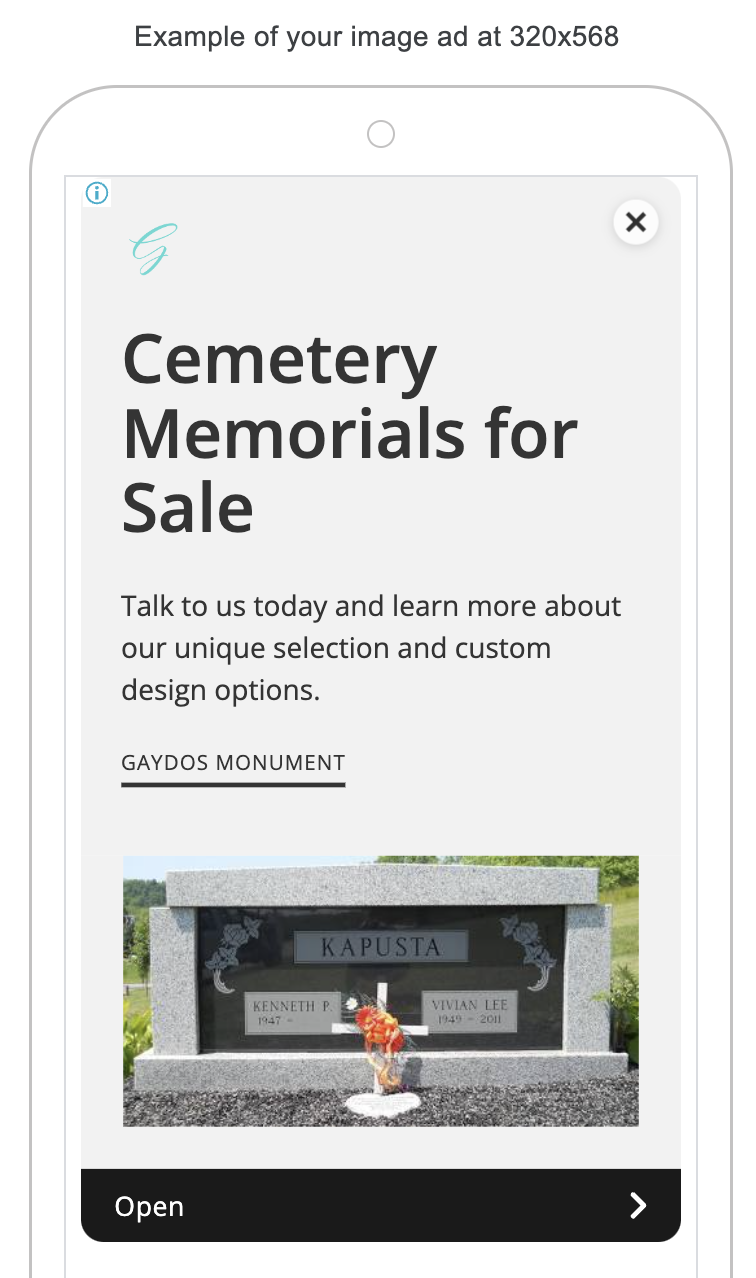
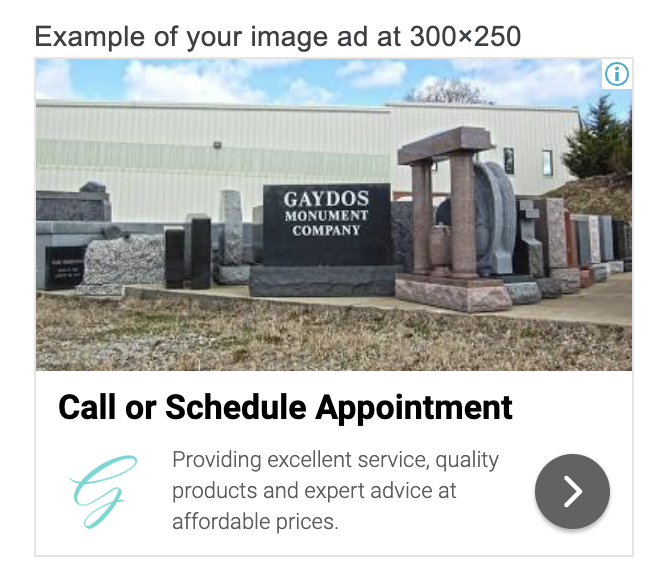
GOOGLE AD EXAMPLES
View a gallery of the many different variations of ads that your current campaign is displaying to consumers.
